How to get the event's analytics data overview?
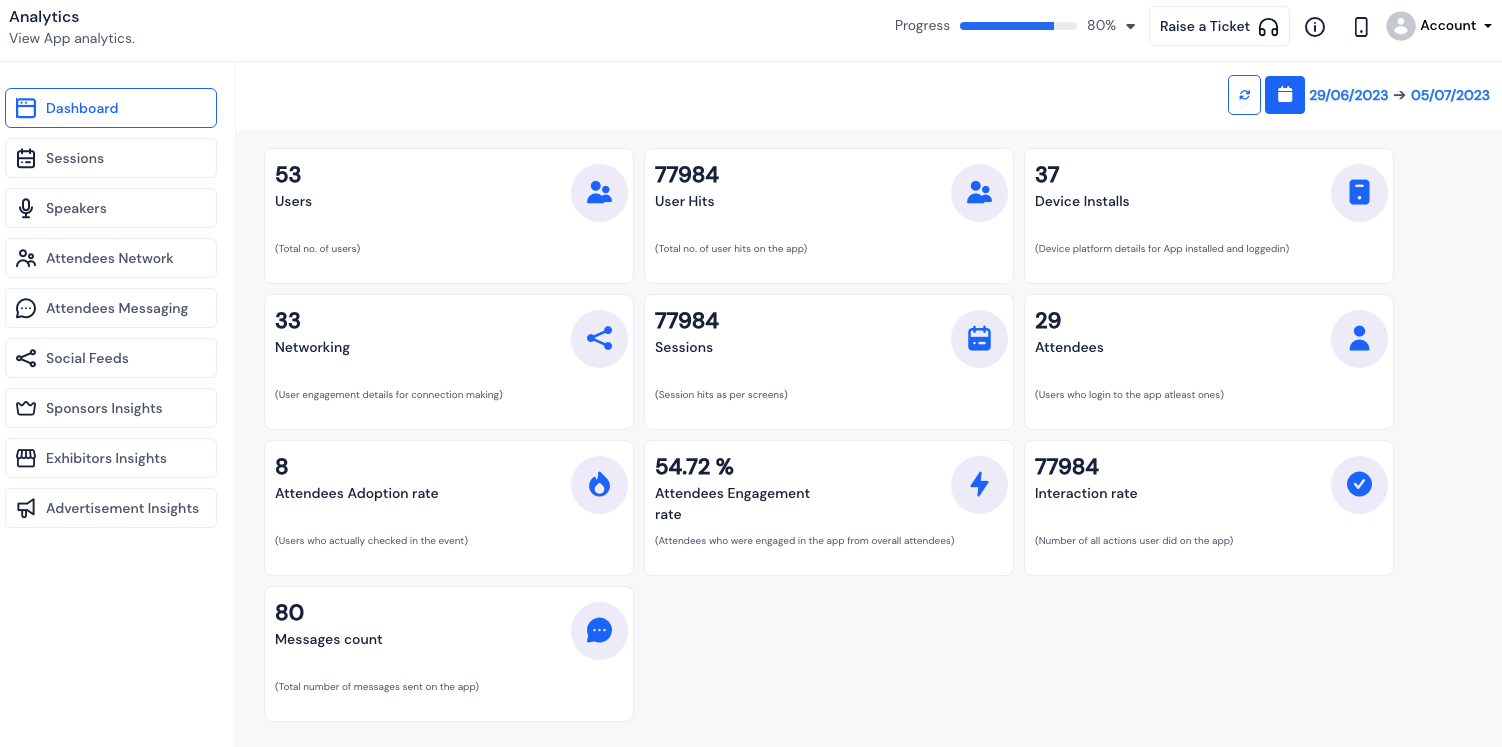
Analytics is one of the most important requirements of any event. Eventify offers a detailed analytics on various metrices. To obtain an overview of the event's analytics data, you just need to Go to the Analytics option. You will get the Dashboard section initially. There are several cards indicating the user traffic and networking rates, as illustrated below.
There are two sections of overview data
Cards#
Users: In this card, the total number of users is presented, providing a clear depiction of the user count.
User Hits : The total number of user hits on the app is showcased, offering insights into the overall level of user activity and interaction.
Device Installs: It showcases the details of the device platforms on which the app has been installed and users have logged in.
Networking: This provides user engagement details related to connection making. It offers insights into how users actively engage and interact with each other.
Sessions: It presents the session hits corresponding to screens, providing insights into the frequency of users accessing various screens within the app during their sessions.
Attendees: It includes app users who have logged in at least once, representing individuals who accessed and engaged with its features, even if for a single session.
Attendees Adoption rate: It represents the proportion of active event attendees who have checked in, indicating higher engagement and involvement.
Attendees Engagement rate: The Attendees Engagement Rate represents the proportion of attendees who actively participated in the app compared to the total attendees.
Interaction rate: It indicates the total number of actions performed by users on the app, providing insights into user engagement and activity levels.
Messages count: The Messages Count represents the overall number of messages sent on the app, serving as a metric for evaluating communication and interaction within the platform.
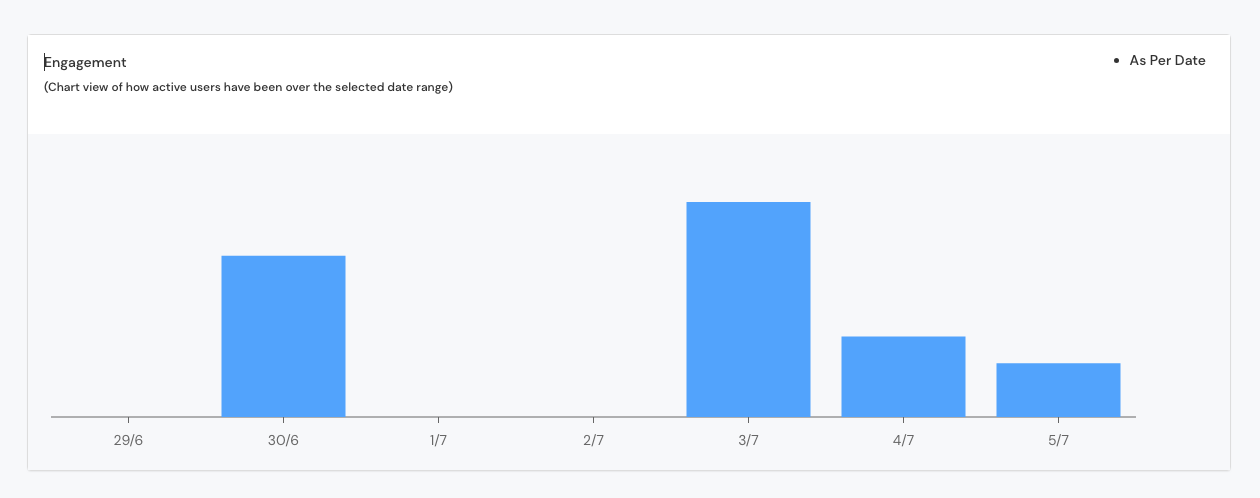
Engagement#
User engagement is depecited on the chart within the chosen date range. You can change the date range to see