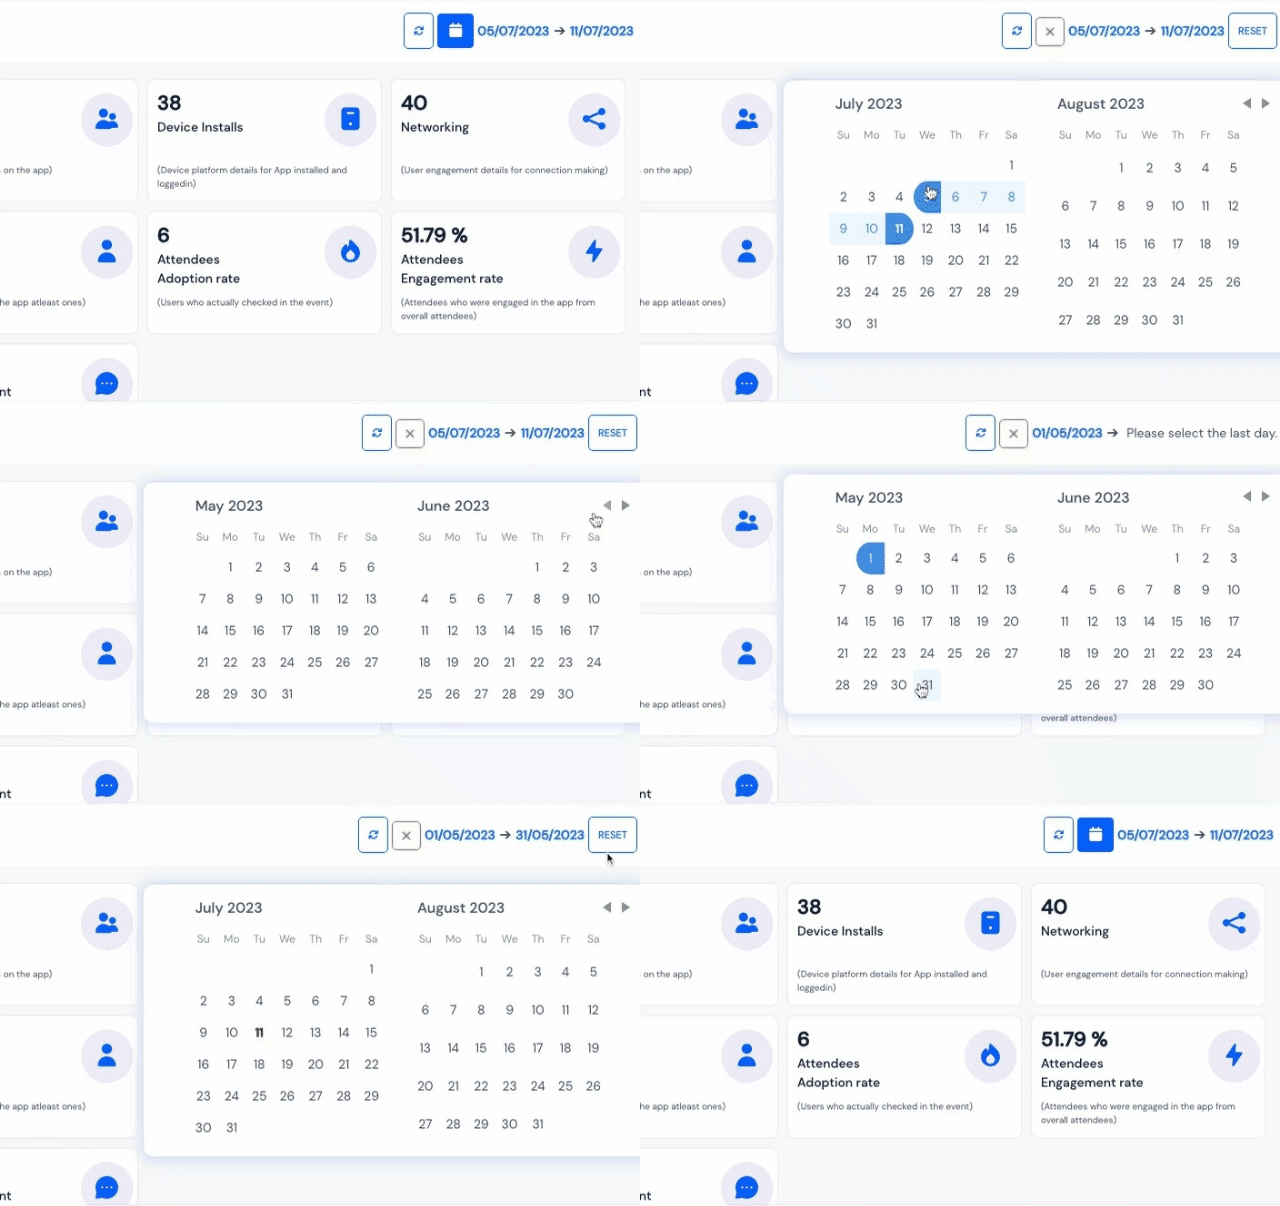
How to get analytics data for a custom range?
Eventify's robust analytics feature provides in-depth insights across various metrics. To gain a comprehensive overview of your event's analytics data, simply navigate to the Analytics option and you will get the Dashboard section initially. You will find the Cards indicating the user traffic and the Engagement Graph. Engagement Graph offers data for a custom date range. The default range is set to weekly but here's how you can change it.
- Click on the Calendar icon
- Select the date range
Note: In order to reset to default range, click on Reset

The other data that offer the custom date range selection are:
- Speakers Insights : Speakers Engagement
- Attendee Network : Network Engagement
- Attendees Messaging : Messaging Engagement
- Sponsors Insights : Sponsors Engagement
- Exhibitors Insights : Exhibitors Engagement